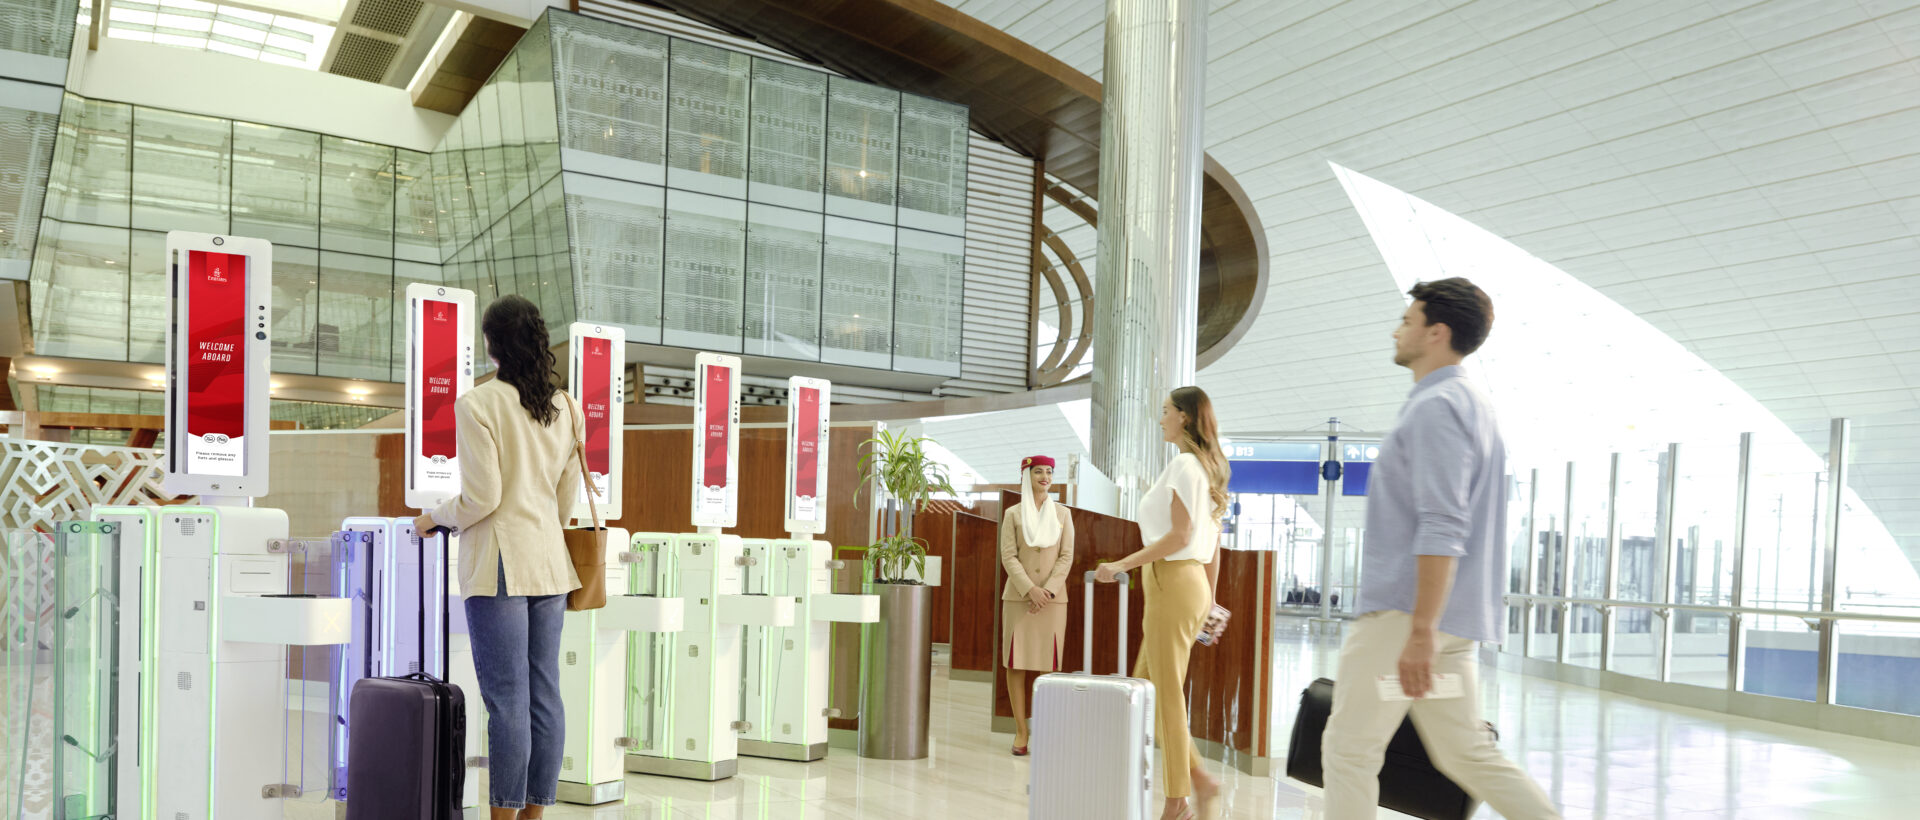
Airports Council International (ACI) World has revealed the 2025 rankings of the world’s busiest airports, highlighting the sector’s leading hubs in terms of total passengers, international passengers, air cargo, and aircraft movements.
Each and every airport involved within the ranking provides a critical service within the global air transport system, enabling the movement of both people and goods worldwide.
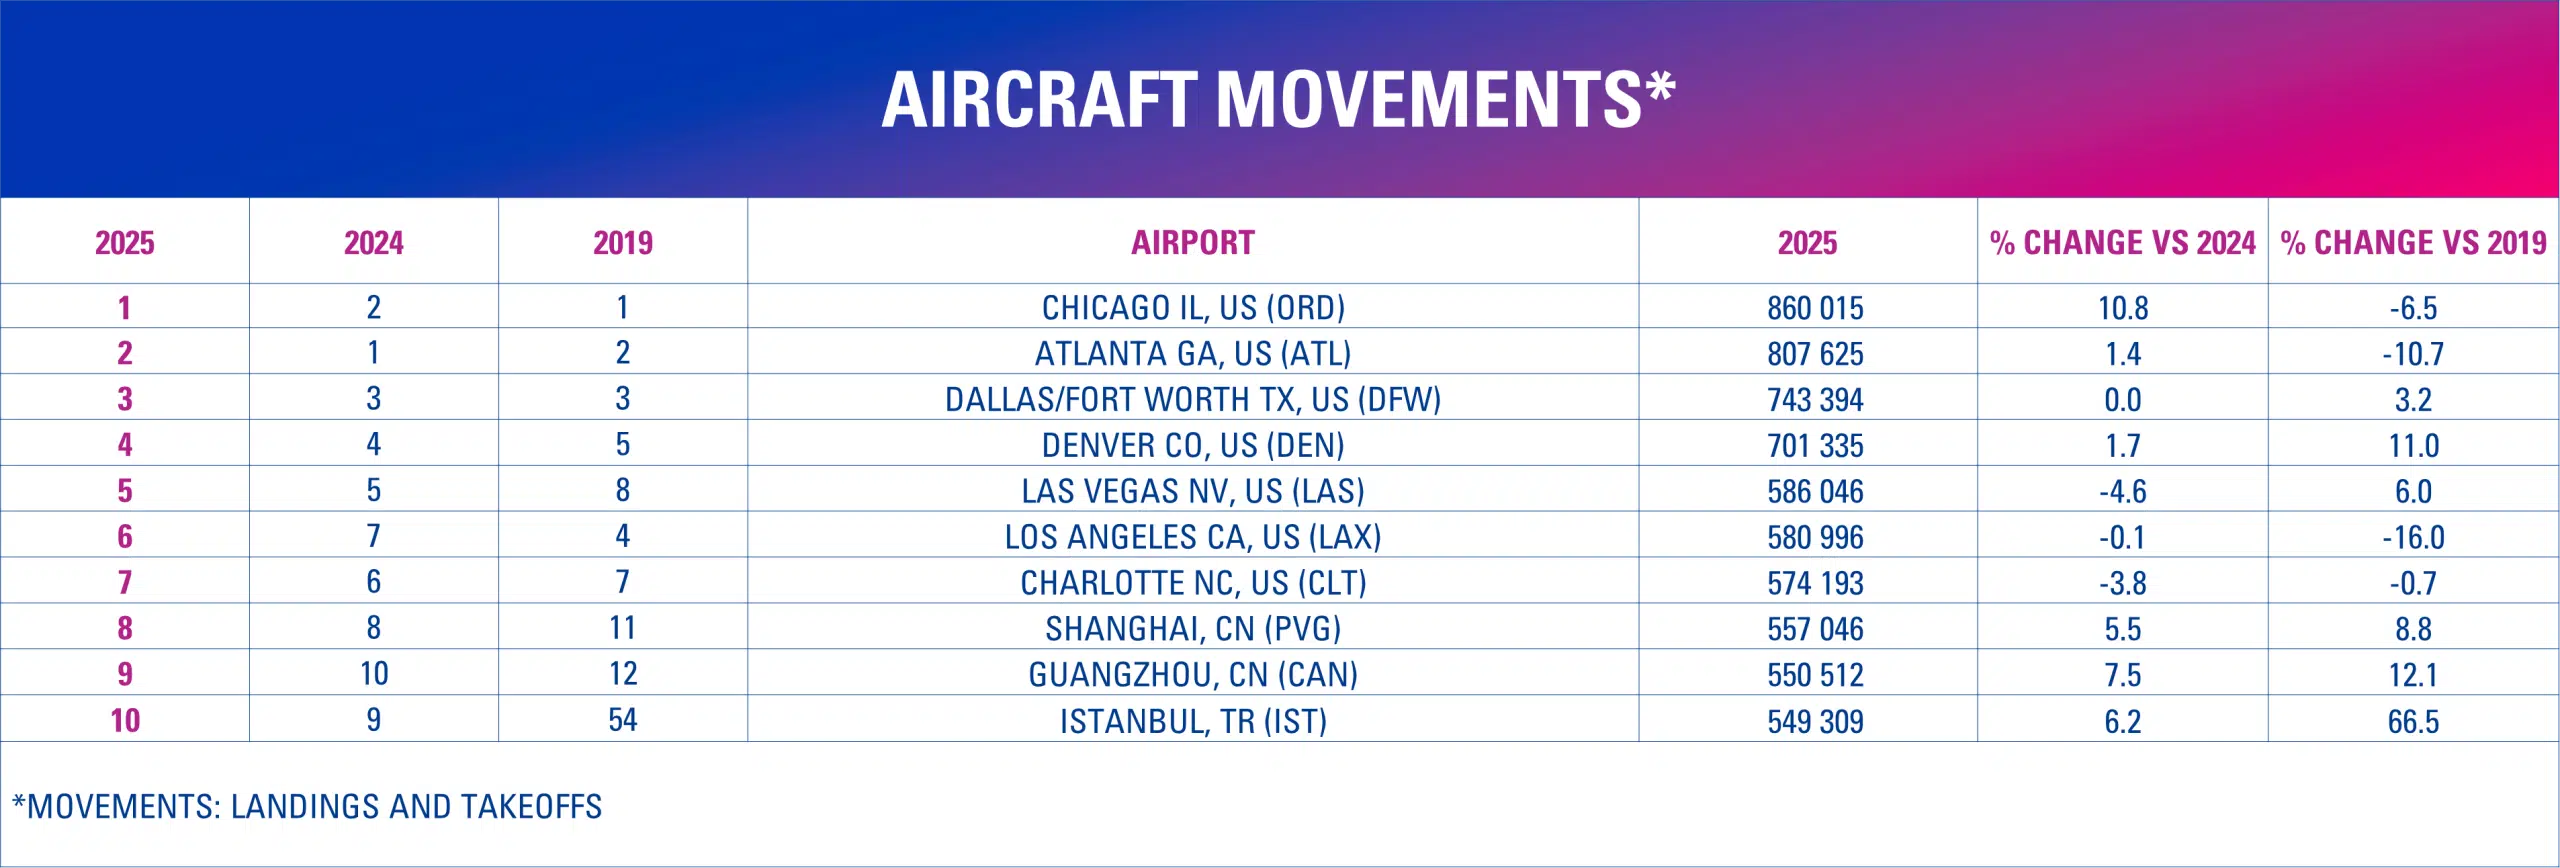
Currently, Hartsfield-Jackson Atlanta International Airport (ATL) remains the busiest airport in the world for passenger traffic (106.3 million), and is closely followed by both Dubai International Airport (DXB, 95.2 million) and Tokyo Haneda Airport (HND, 91.7 million), whilst Chicago O’Hare International Airport (ORD) ranks first for overall aircraft movements.
Passenger highlights include a total number of 9.8 billion – an increase of 3.6% from 2024, or a 7.3% gain from 2019, whilst the top 10 busiest airports account for 9% of all global passenger traffic. Asia-Pacific airports are rebounding, driving major changes in global airport rankings, with Shanghai Pudong recording the biggest jump in the top 10 – rising from 10th to 5th due to to international traffic recovery, visa policy easing and expanded connectivity.
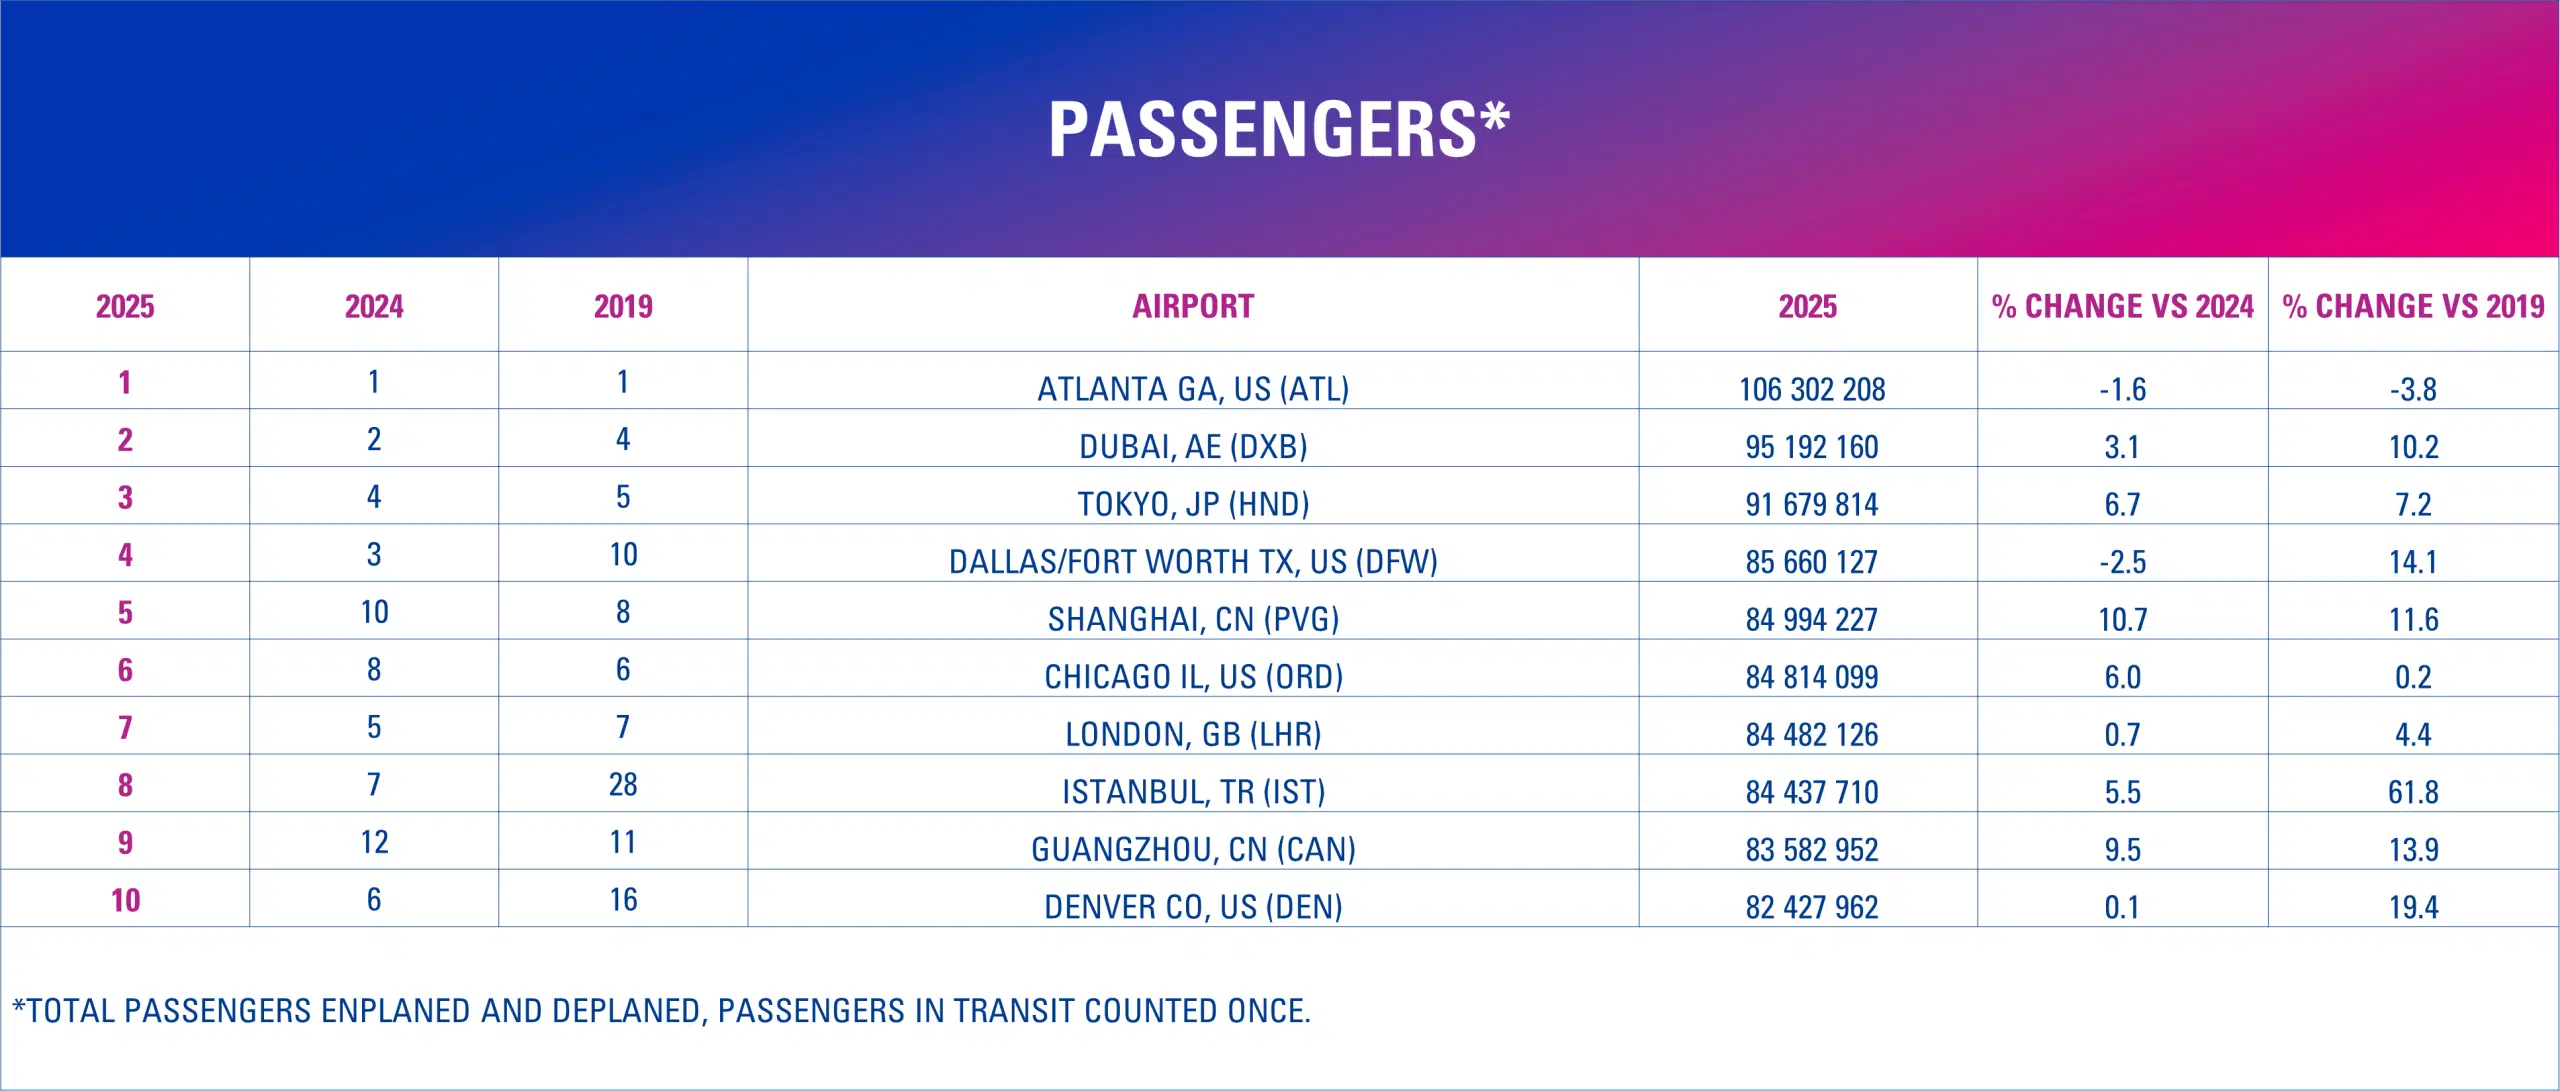
Within the top 10; 4 airports are situated in the United States (ATL, DFW, ORD), reflecting continued market strength. Between the group, they possess a significant share of domestic passengers (80–95% domestic traffic).
ACI World Director General Justin Erbacci said:We congratulate the world’s busiest airports for managing growing air travel demand amid increasing operational complexity. These hubs keep people and goods moving, supporting global trade, tourism, and economic growth in their communities and regions.
To help keep pace with rising demand, governments must prioritise sustained investment in airports and the broader aviation ecosystem.
The industry has remained resilient across 2025, with global GDP growing ~3.0–3.2% – which sits above expectations but below historical norms, with ongoing risks from trade tensions, protectionism, and policy uncertainty affecting air travel demand. Meanwhile, lower fuel prices and easing inflation supported overall demand, whilst global recovery has predominately been led by international traffic, with global airport traffic rising by 3.6% (driven driven by international demand and Asia-Pacific recovery, while North American and European hubs neared saturation).
Capacity across the industry has been shown to be a clear constraint, with growth limited by infrastructure and slot constraints in some regions, as well as aircraft delivery backlogs and air navigation limitations. Geopolitical situations are also affecting traffic flows, with airspace closures and conflicts leading to increased flight times and costs, prompting rerouting and, in some cases, shifts toward alternative hubs. The return of Chinese travel has shown to have accelerated growth across Asia-Pacific and major hubs, strengthening overall global connectivity, whilst air cargo volumes stabilised near record levels and were supported by e-commerce and faster, restructured global supply chains.
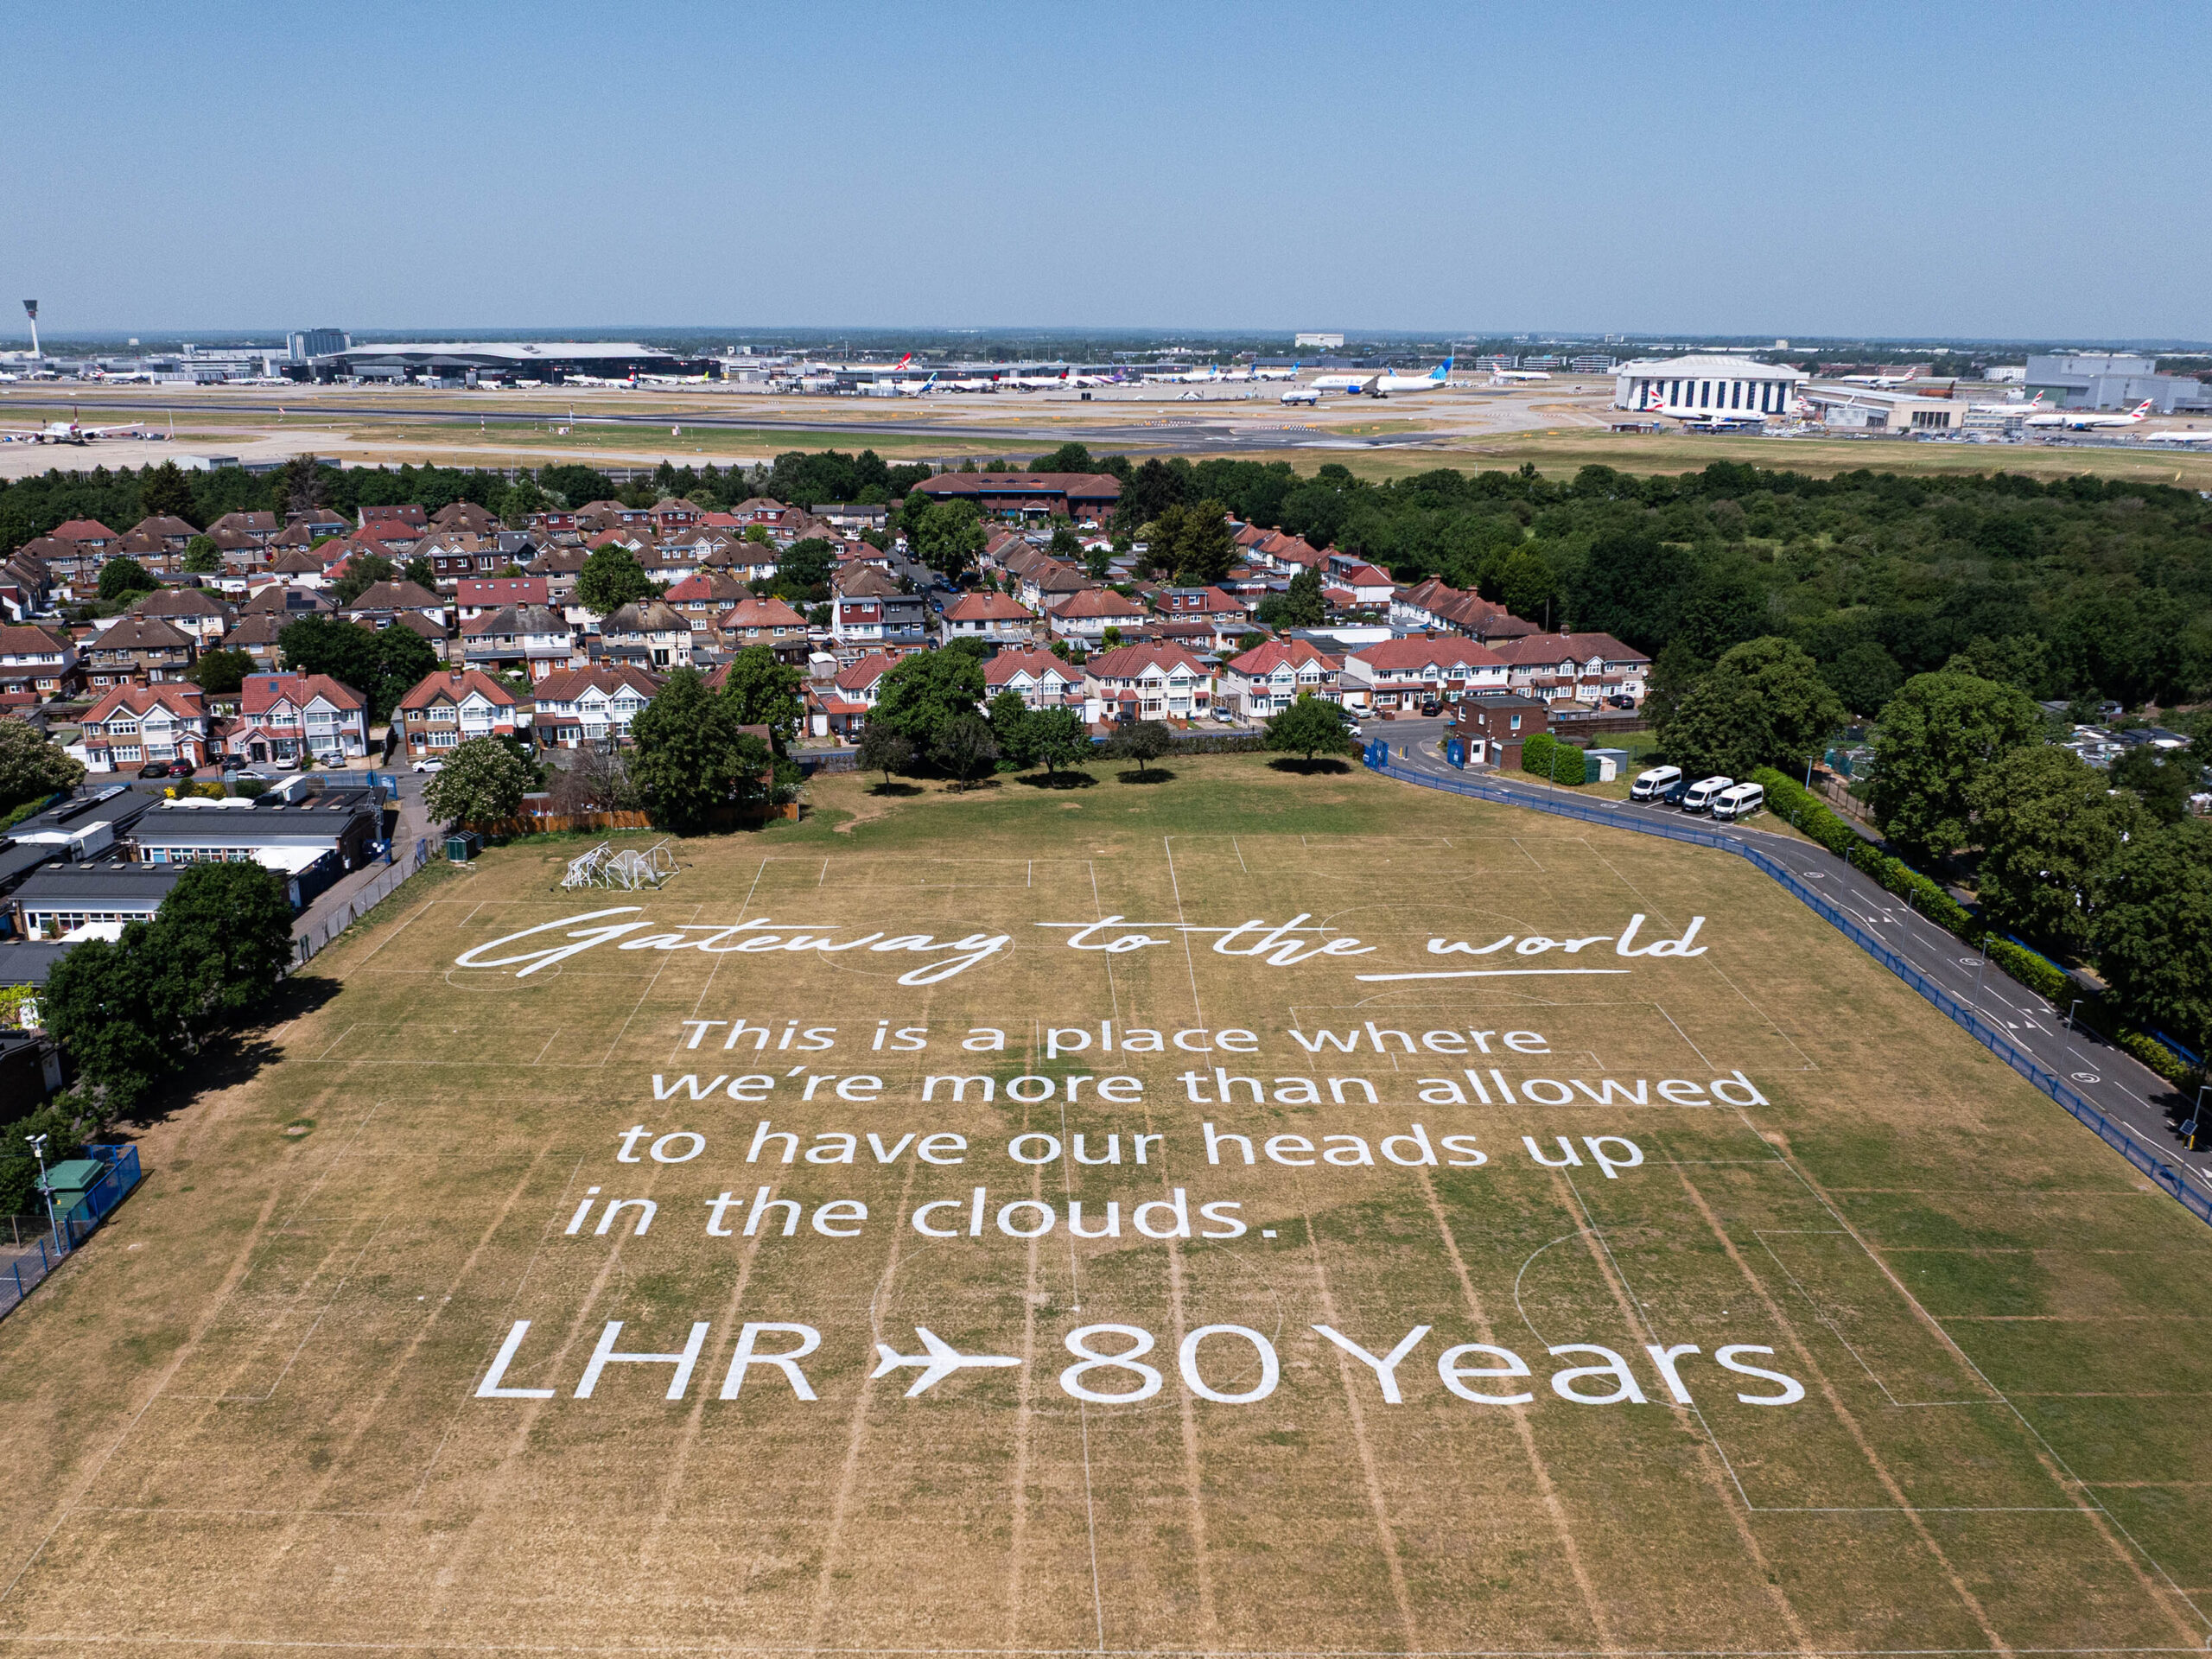
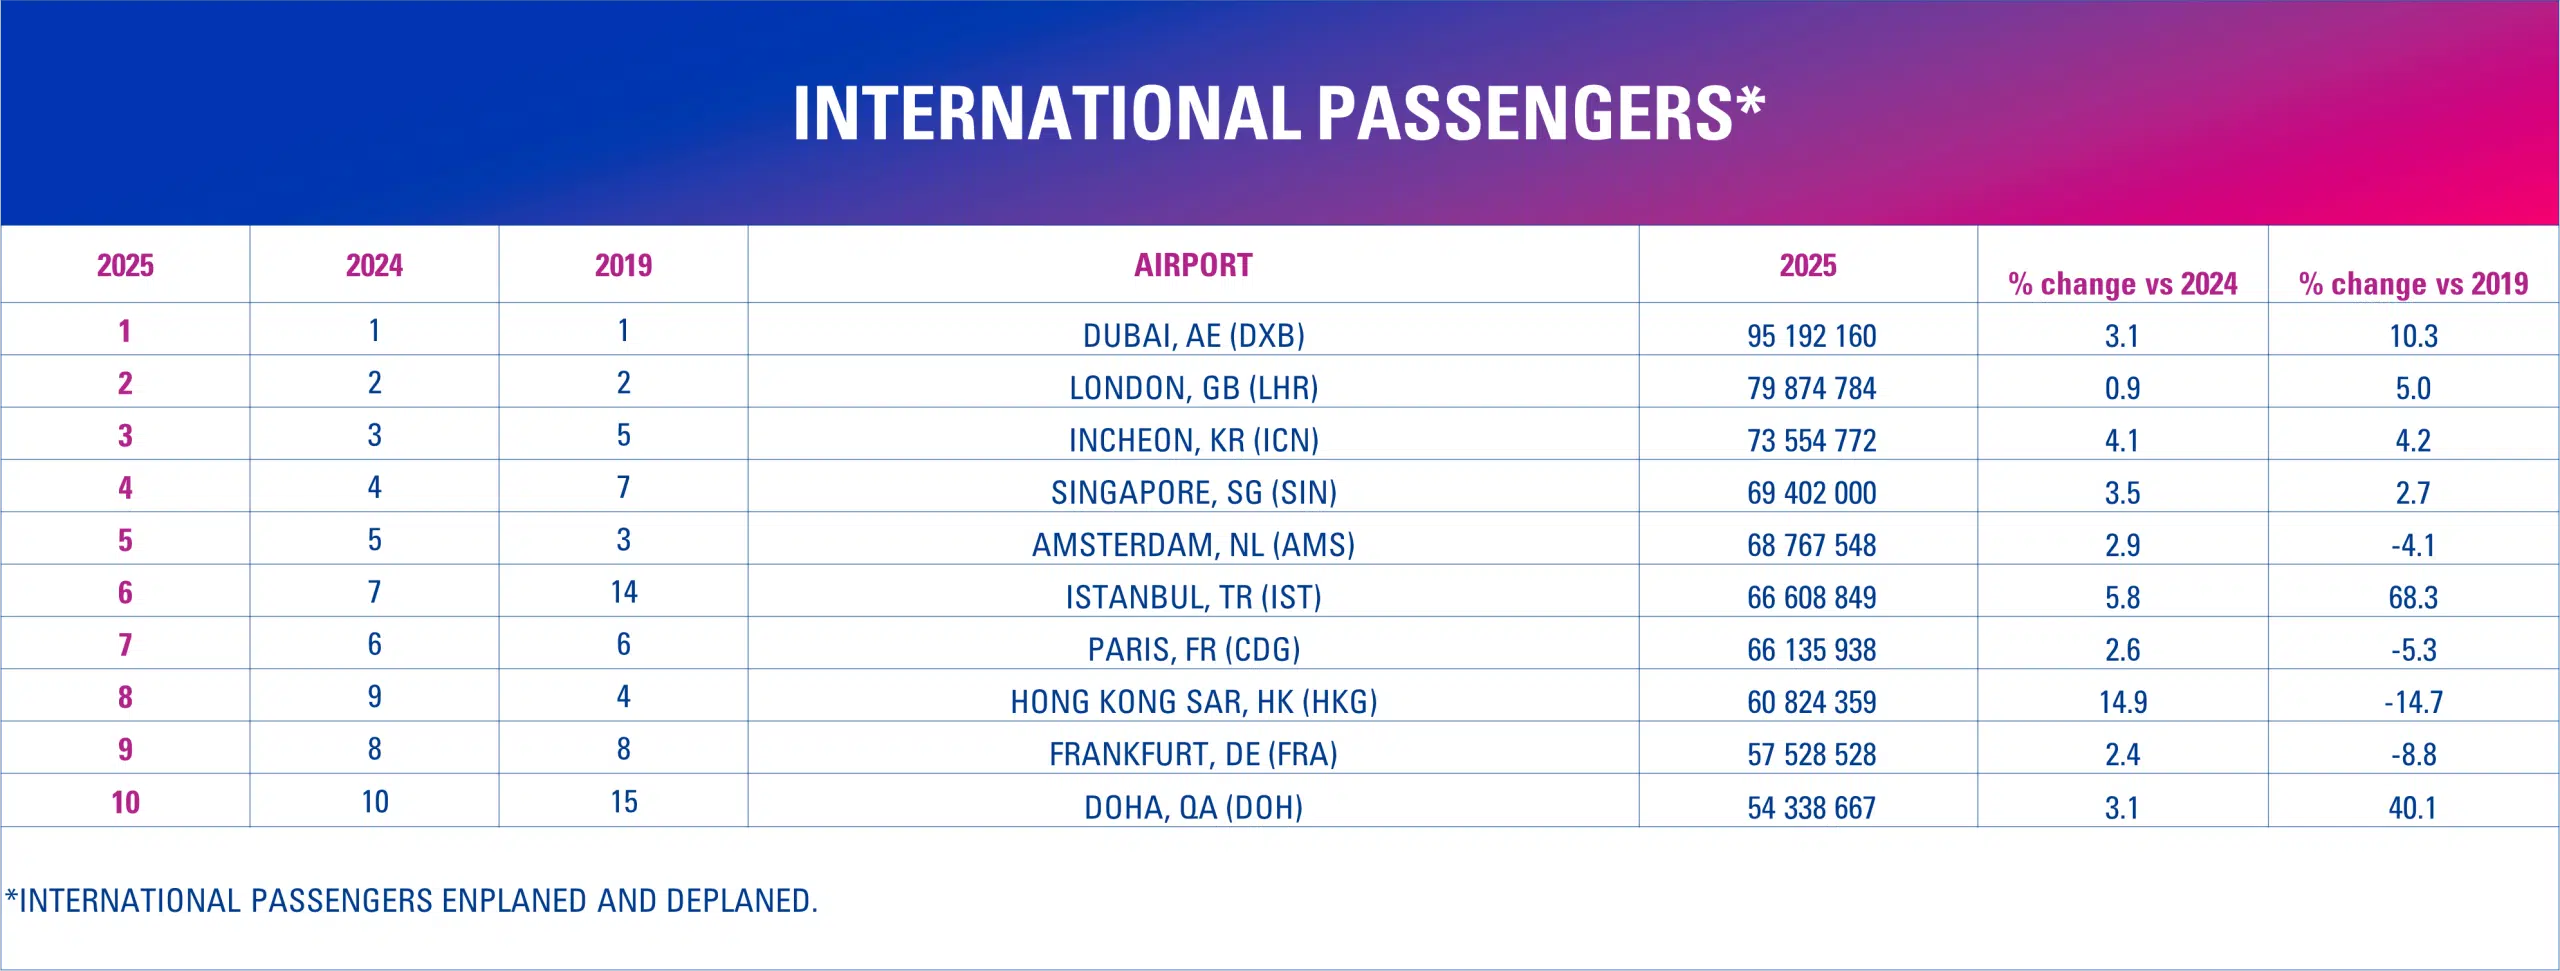
International passenger traffic in 2025 reached 4.0 billion – a gain of 5.9% vs 2024, and 8.3% vs 2019, with the top 10 busiest airports for international passenger traffic representing 17% of all international traffic. Of these, DBX remains first, whilst London Heathrow (LHR) and Incheon (ICN) retain their second and third positions.
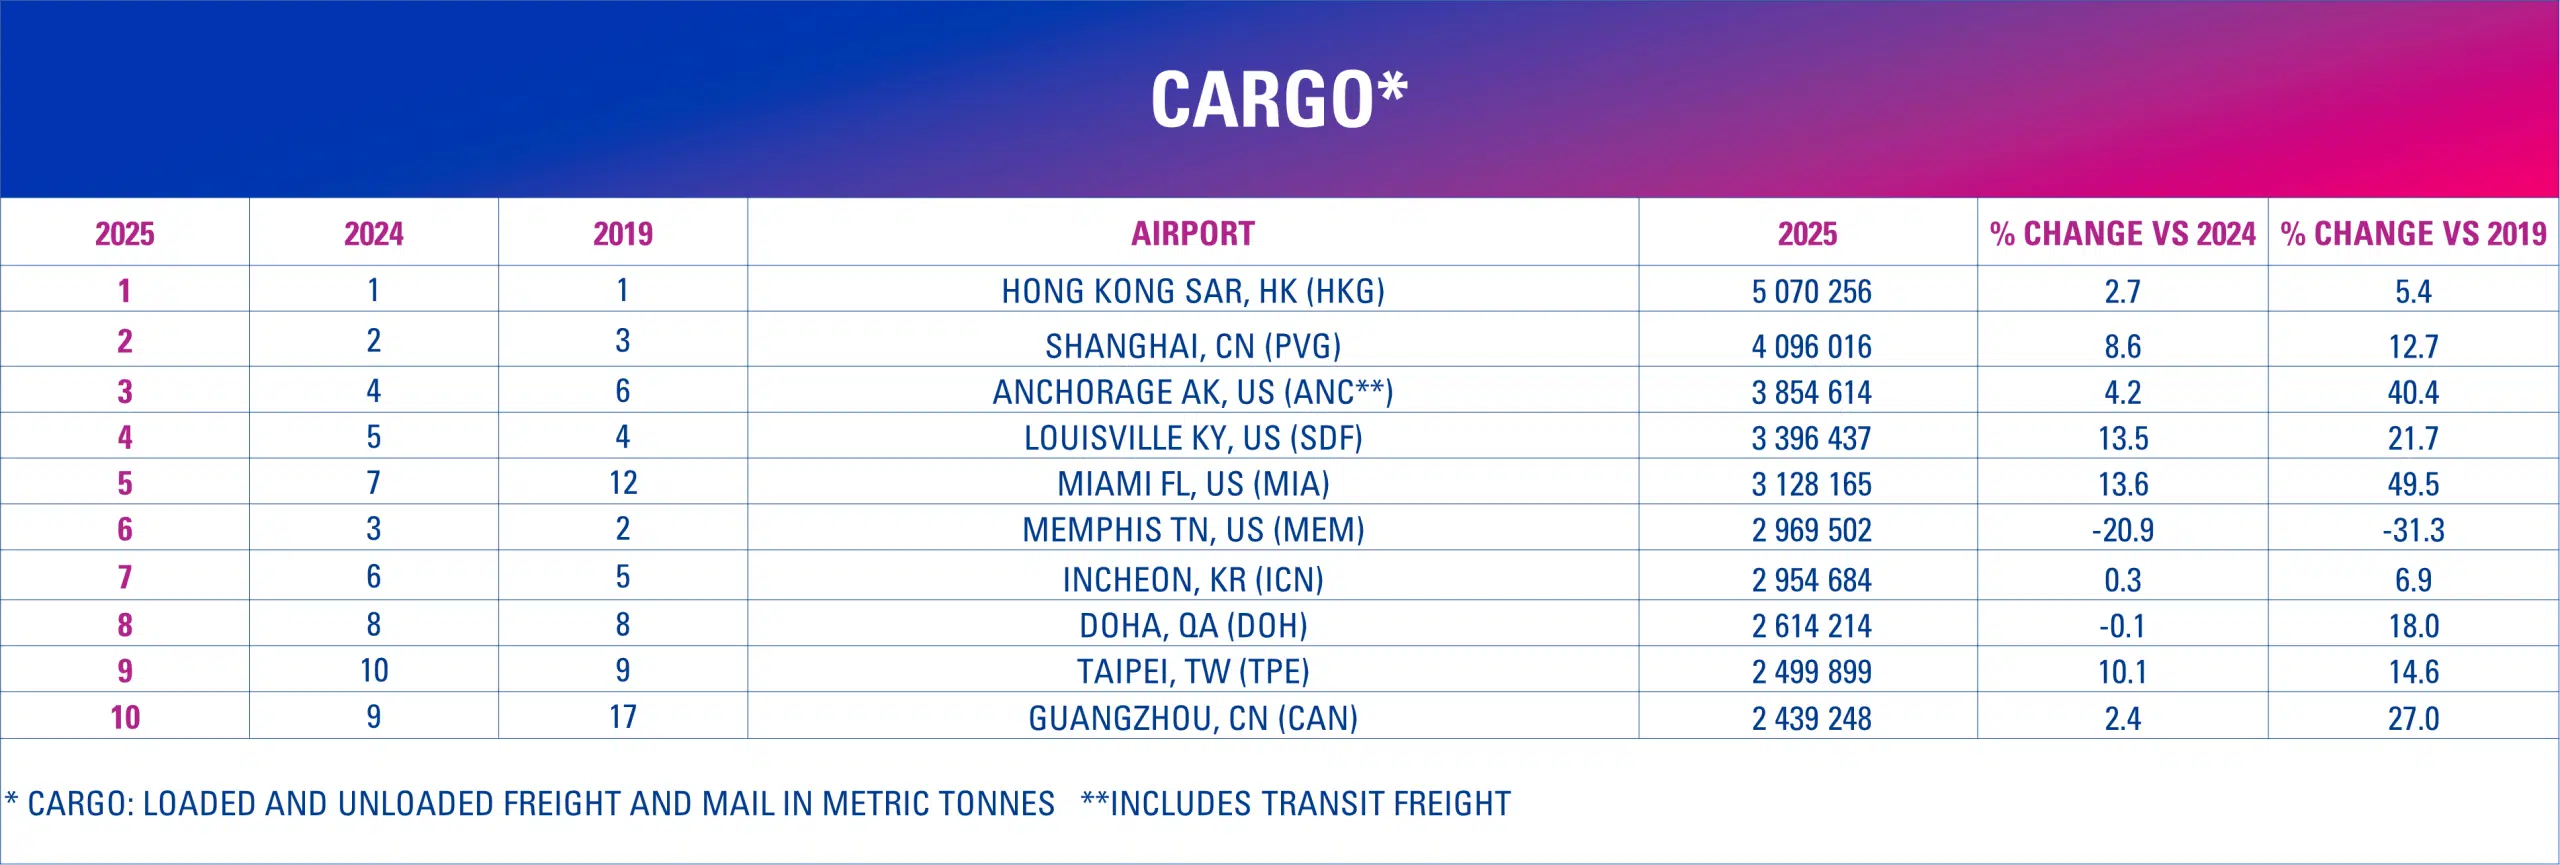
Air cargo volumes across 2025 are estimated to have increased by 2.9% year-over-year, almost +8.8% vs 2019, to nearly 128.9 million metric tonnes. Air cargo traffic has shown to be more concentrated amongst the main airports, with air cargo volumes within the top 10 airports representing close to 26% of global air cargo traffic. Increase is believed to have been driven by strong e-commerce demand, as well as supply chain adjustments, with Hong Kong HKG) and Shanghai Pudong (PVG) remaining in 1st and 2nd rank respectively, and Anchorage gains 3rd rank.
Finally, global aircraft movements have been estimated to be around 101.5 million in 2025 – representing a gain of 2.3% from 2024 results (or +0.2% vs 2019), with the top 10 airports for aircraft movement representing 6.4% of global aircraft movements.